Gold terminates the last sceptics:
Gold terminates the last sceptics: Gold surged to new highs with a 1.3% weekly gain, defying profit-taking dips post-Fed rate cuts. As U.S. bond yields rise, gold’s appeal as a capital preservation asset is tested, hinting at a possible peak. Technical indicators suggest potential upward momentum toward $2640, while a significant gap from the 200-week moving average raises concerns of a correction to $2000. Stay informed about the evolving gold market dynamics and potential trading opportunities
Gold terminates the last skeptics

Gold started the week with new highs and ended the week with a 1.3% gain, digesting a 2% dip on profit-taking following the Fed’s rate decision. The loosening of monetary policy by more than economists had expected and forecasts of further active cuts brought back appetite for risk assets. However, the turnaround in US 10-year government bond yields has set a more cautious tone.
A fall in government bond yields increases interest in gold as an alternative to capital preservation, all other things being equal. This inverse correlation worked well last year but has started to fail this year and broke down this week when gold prices and yields started to rise simultaneously. If this is not a sign of a flight from dollar assets, it may be a sign that gold is nearing a peak.
The forced liquidation of short positions may push the gold price higher into historical highs, as the US dollar generally holds its ground against a basket of major currencies, and rising bond yields create an unfavourable environment for gold.
Sign up to trade Gold with FXPRO
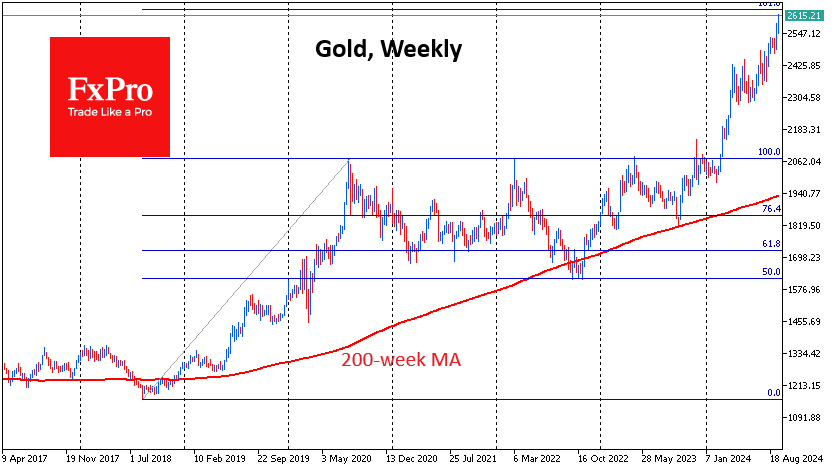
From a technical point of view, the area of attraction for the price seems to be $2640, which is the 161.8% level from the initial upward momentum in August 2018 to the peak in August 2020. This was followed by two years of trading in a wide range, with the deepest decline in September-October 2022, which set the stage for a new advance.
If gold continues to follow its two-year cycles, the upside momentum could soon be replaced by a sideways or sharp reversal like we saw in 2011.
Major turning points in gold over the past six years have come at the touch of the 200-week simple moving average. It is now almost 40% or over $1100 behind the price. In absolute terms, this is the largest gap since 2011 and in relative terms since 2020. This difference makes the potential for a correction that could take the price to $2000 within a year or two enormous.
The accumulated overbought conditions in gold does not imply an immediate reversal. On the contrary, the most violent part of the rally, with a massive short squeeze, may still be ahead. However, traders should also be on the lookout for signs of growth exhaustion, which could follow a very sharp correction.