Gold tries to break out of a triangle
Gold tries to break out of a triangle: Gold nears a breakout from a triangle pattern, testing $2525 resistance with rising support. Buyers are taking the initiative as the price consolidates near historical highs. Key drivers include dollar weakness and upcoming Fed decisions
Gold tries to break out of a triangle

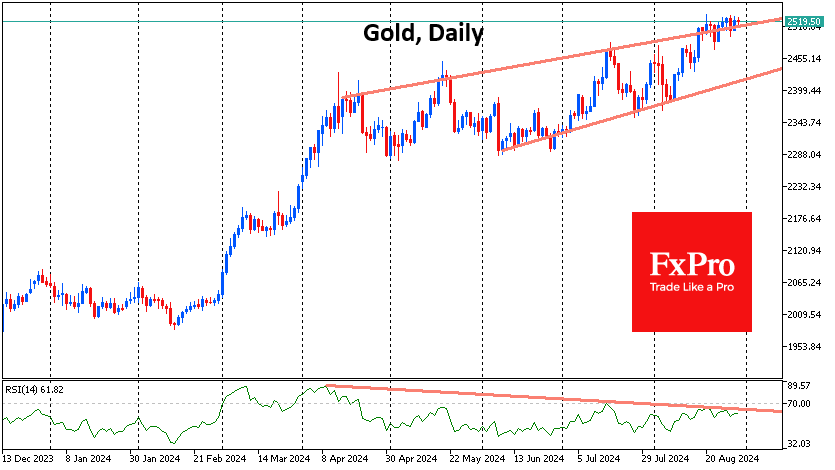
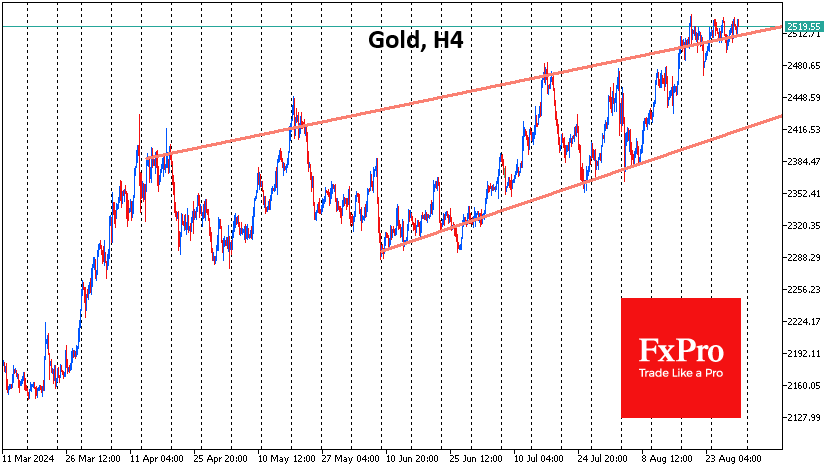
Gold has hit a glass ceiling at $2525 an ounce on the spot market, which it has been battling against
for the past two weeks. A series of smaller and smaller pullbacks and more frequent rallies to the
resistance indicate impressive buying pressure. Under these conditions, we should expect a breakout
to the historical highs soon, but it will be important to watch how the price behaves afterwards.
Over the past two weeks, a triangle of horizontal resistance and rising support has formed on the gold
chart. This is a clear indication that buyers are taking the initiative at increasingly higher levels.
The same conclusion can be drawn if we look at the longer-term chart period since April, when the
trend of increasingly shallow corrections continued. The current consolidation is an oscillation around
the upper boundary of the uptrend since then.
Switch to FXPRO today to trade gold like a savvy

In the daily timeframe, we continue to see a divergence between the RSI and the price trend, which is
a sign of upward exhaustion. However, we saw a similar situation from October 2023 to February
2024, which was followed by a strong uptrend rather than a short-term uptrend.
One of the main drivers of the gold price over the past two months has been the dollar near 5%
weakness against a basket of major currencies, which largely explains the 8.5% appreciation in the
ounce. However, we note that the DXY is attempting to reverse its direction to the upside as it
reaches the lower end of its trading range in early 2023.
Together, these signals point to a likely near-term break of resistance with a renewal of historical
highs, which could be followed by a medium- or even long-term reversal in the dynamics of the gold
price.
If we take a look beyond the charts, gold’s short-term fate will be determined by the Fed's monetary
policy outlook: how much it will cut interest rates before the end of the year. The monthly Employment
report on September 6th and the CPI on the 11 th will help clarify the answer.